



Hey folks!
Here’s my latest curation of papers, commentary, ideas etc. Nexus Notes now has a paid section — the format will vary each issue. Last time, I connected the dots between diverse topics. This time, I'm taking you under the hood. Next time, it might be a deeper dive, an in-depth explainer, or a short video. What stays the same is that every issue gives you a working scientist's eye on what matters — and why.
I.
Signal of the week.
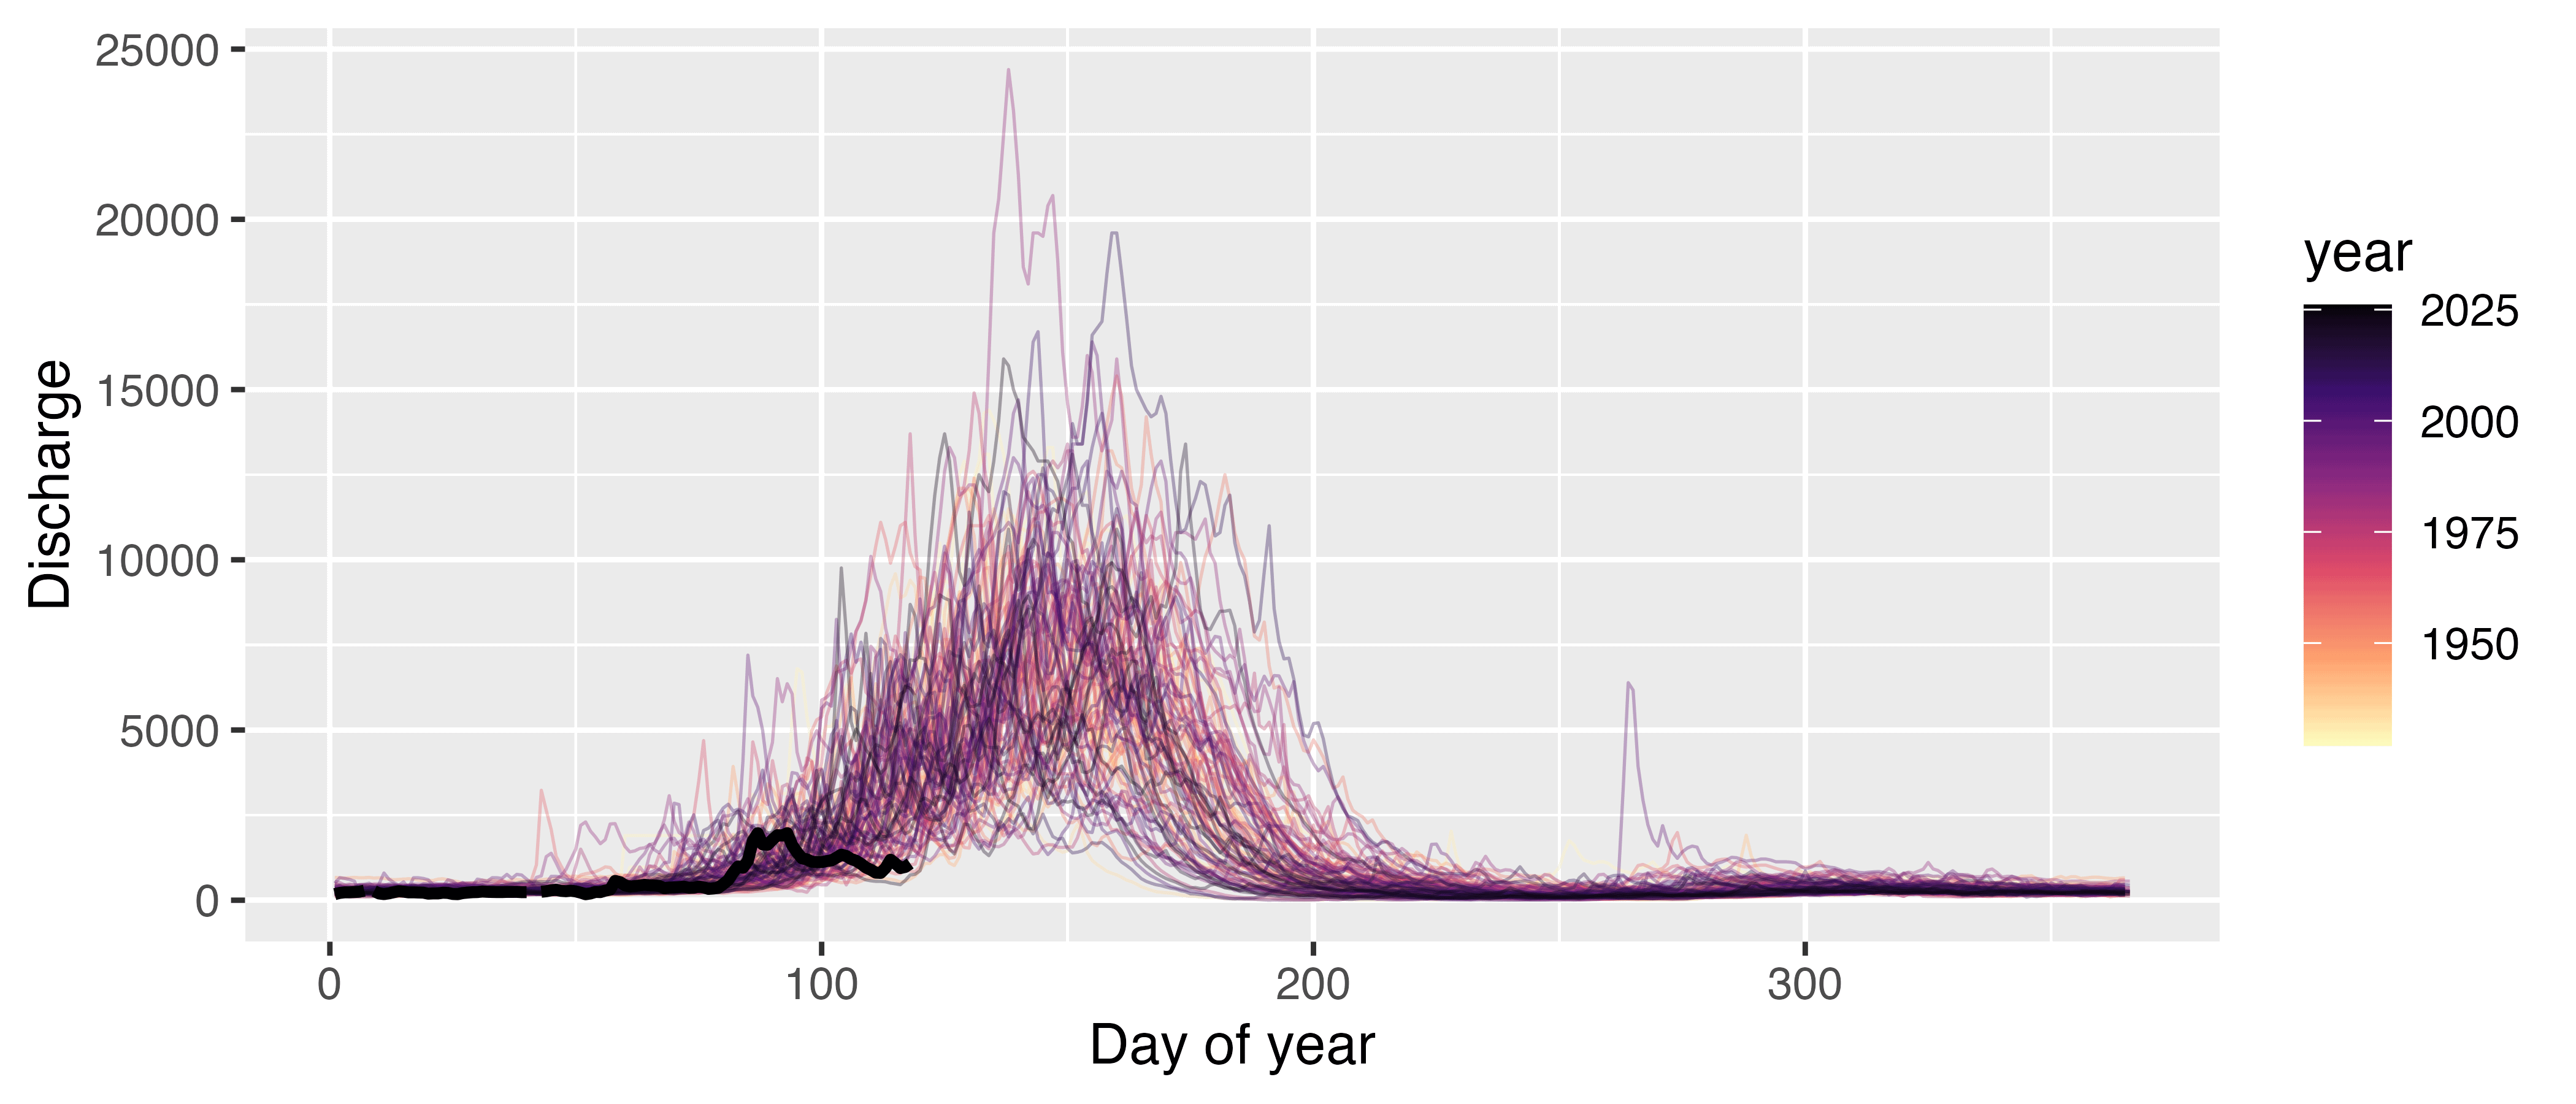
Last week, I talked about the record low snowpack in Colorado and how there won't be enough snowmelt it to generate the floods cottonwoods and other species depend on. Well, this is what it looks like in the Yampa River, Colorado right now (see caption):
II.
How this situation in the western US will combine with the predicted super El Niño this year, I’m not sure — how each El Niño plays out is highly varied. But scientists are concerned about the magnitude of this year’s potential upcoming event. The stronger they are, the more extreme weather events we should expect.
III.
More on the seasons: Changes in the timing of leaf fall and the order at which different trees drop their leaves can impact how ecosystems cycle carbon, even when the amount of material remains the same. In this experimental study, earlier arrival of high-quality leaves enhanced the feeding of an abundant aquatic shredder (the amphipod Gammarus fossarum) on low-quality leaves. Once again, very subtle changes in seasonal regimes can have dramatic consequences on ecological processes.
IV.
Number of the week.
30 — The number of years it takes for a tropical forest to recover to ~75% similarity in its composition of species to old-growth forests when looked after. Biodiversity can recover fast when given the right conditions!
V.
Day Zero. I’ve been teaching third-year students about water security. Cape Town came dangerously close to running out of water entirely in 2018. One of the solutions since then has been to remove nonnative trees in the water supply catchments, which suck up a lot of water. A Nature Conservancy analysis found Cape Town could unlock the equivalent of two extra months of water supply annually within six years by clearing nonnative trees from its watersheds.
VI.
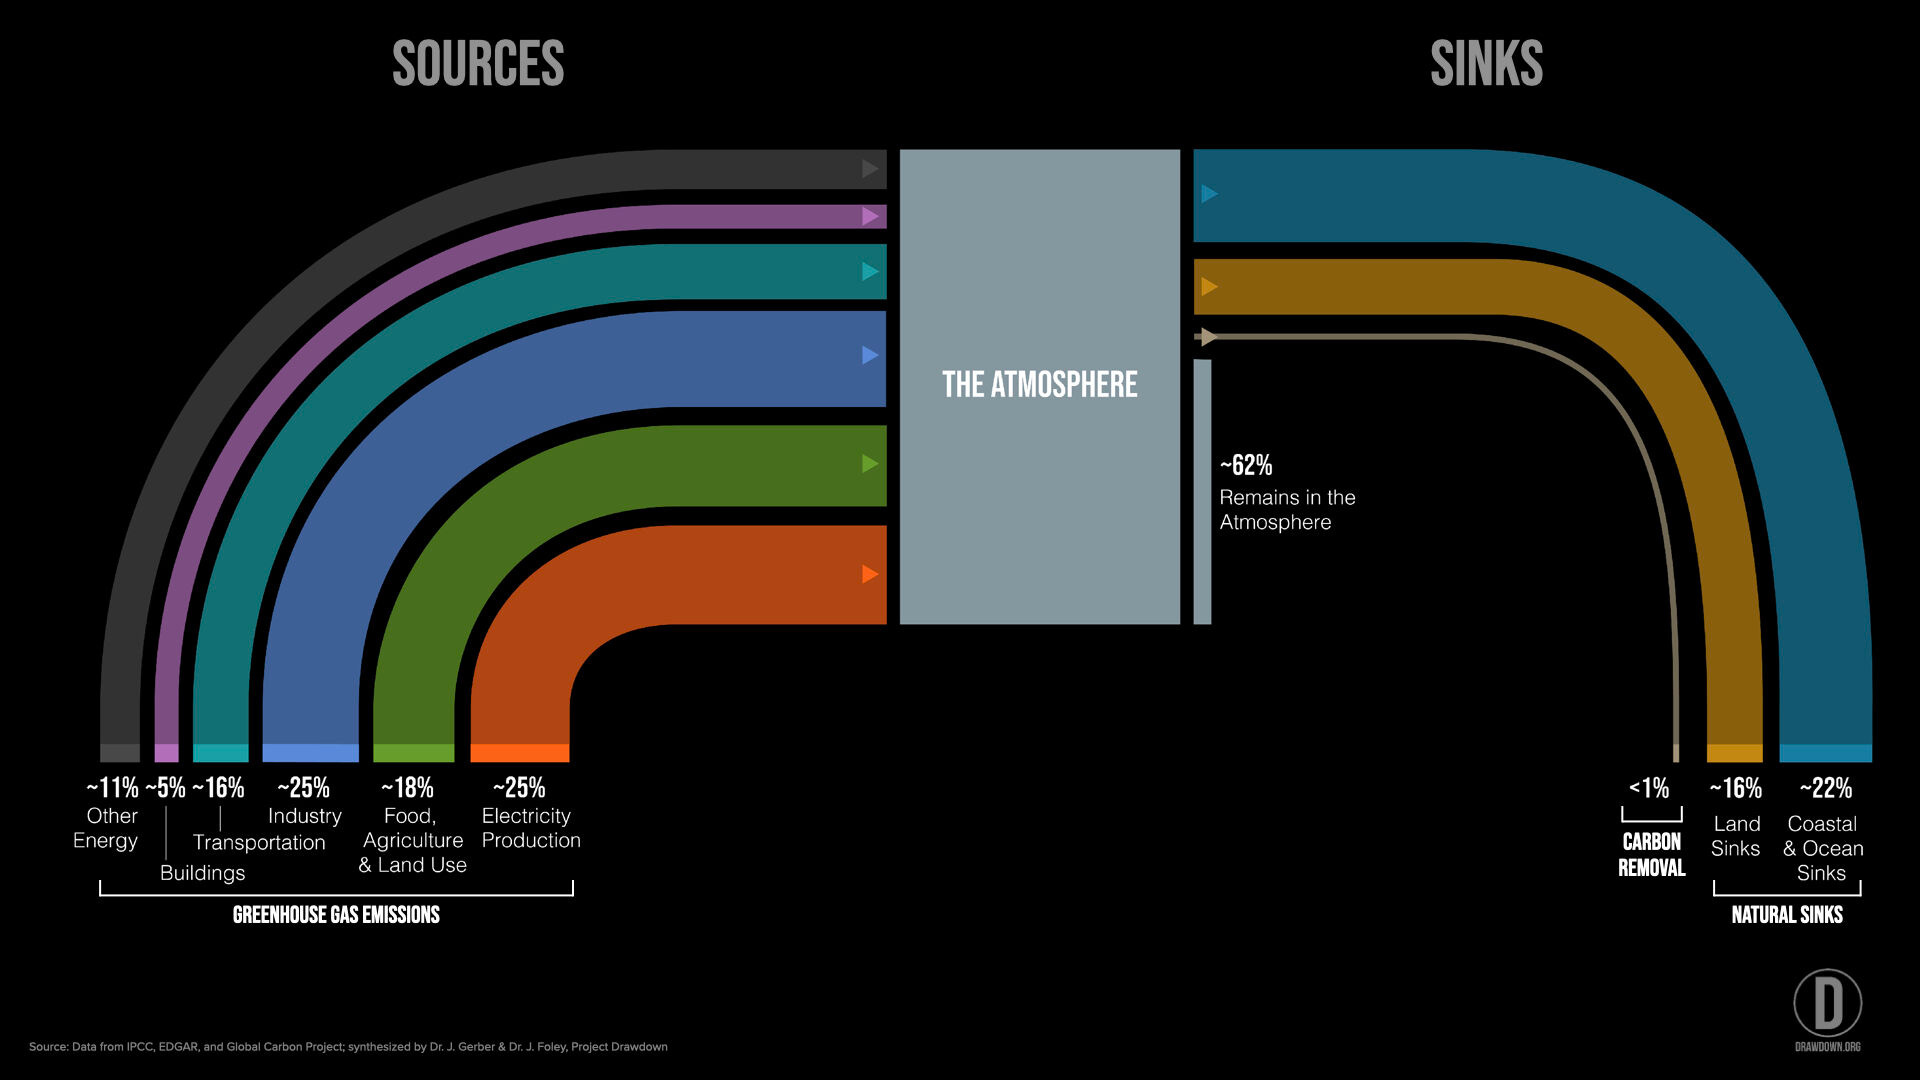
Graphic of the week.
The basic "big picture" of climate change from Jonathan Foley of Project Drawdown. The LinkedIn post gives the details.
VII.
Welcome Jeff opperman to Substack! Jeff is a wonderfully creative writer about the natural world. He’s also the Global Freshwater Lead Scientist at WWF. I can’t wait to read more of Jeff’s writing here. His latest discusses why the economic case for nature isn't enough — and why we need the language of the soul, not just the balance sheet.
VIII.
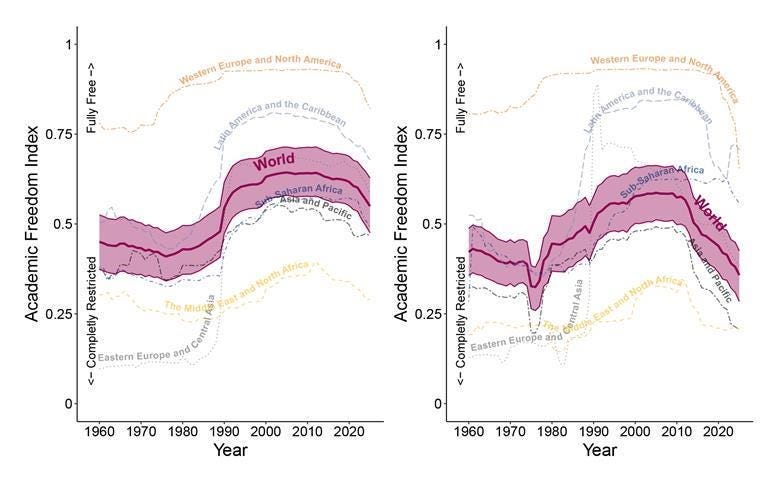
Academic freedom is declining worldwide — the US is showing particularly bad signs.
IX.

I couldn’t resist this one. Thanks to Ben Taylor for alerting me to it. Write your name (or newsletter) in Landsat images, from NASA.
X.
Nature spotlight.
Meet Dolomedes aquaticus — a fascinating fishing spider.
These wonderful creatures live on the banks of gravel-bed rivers in New Zealand (in this case, Dry Stream near Porter’s Pass) and feed on aquatic insects by fishing from the margins. With back legs anchored and the rest of their body floating, they feed at night by sensing vibrations from prey through the water surface. More here.
Under the hood
The plot of Yampa River flows earlier in the post shows how low flows are already looking for 2026. But there's another way to look at the same river that reveals something different: its rhythm and personality across seasons. This is the Joy Division version I shared in my post on river extremes.
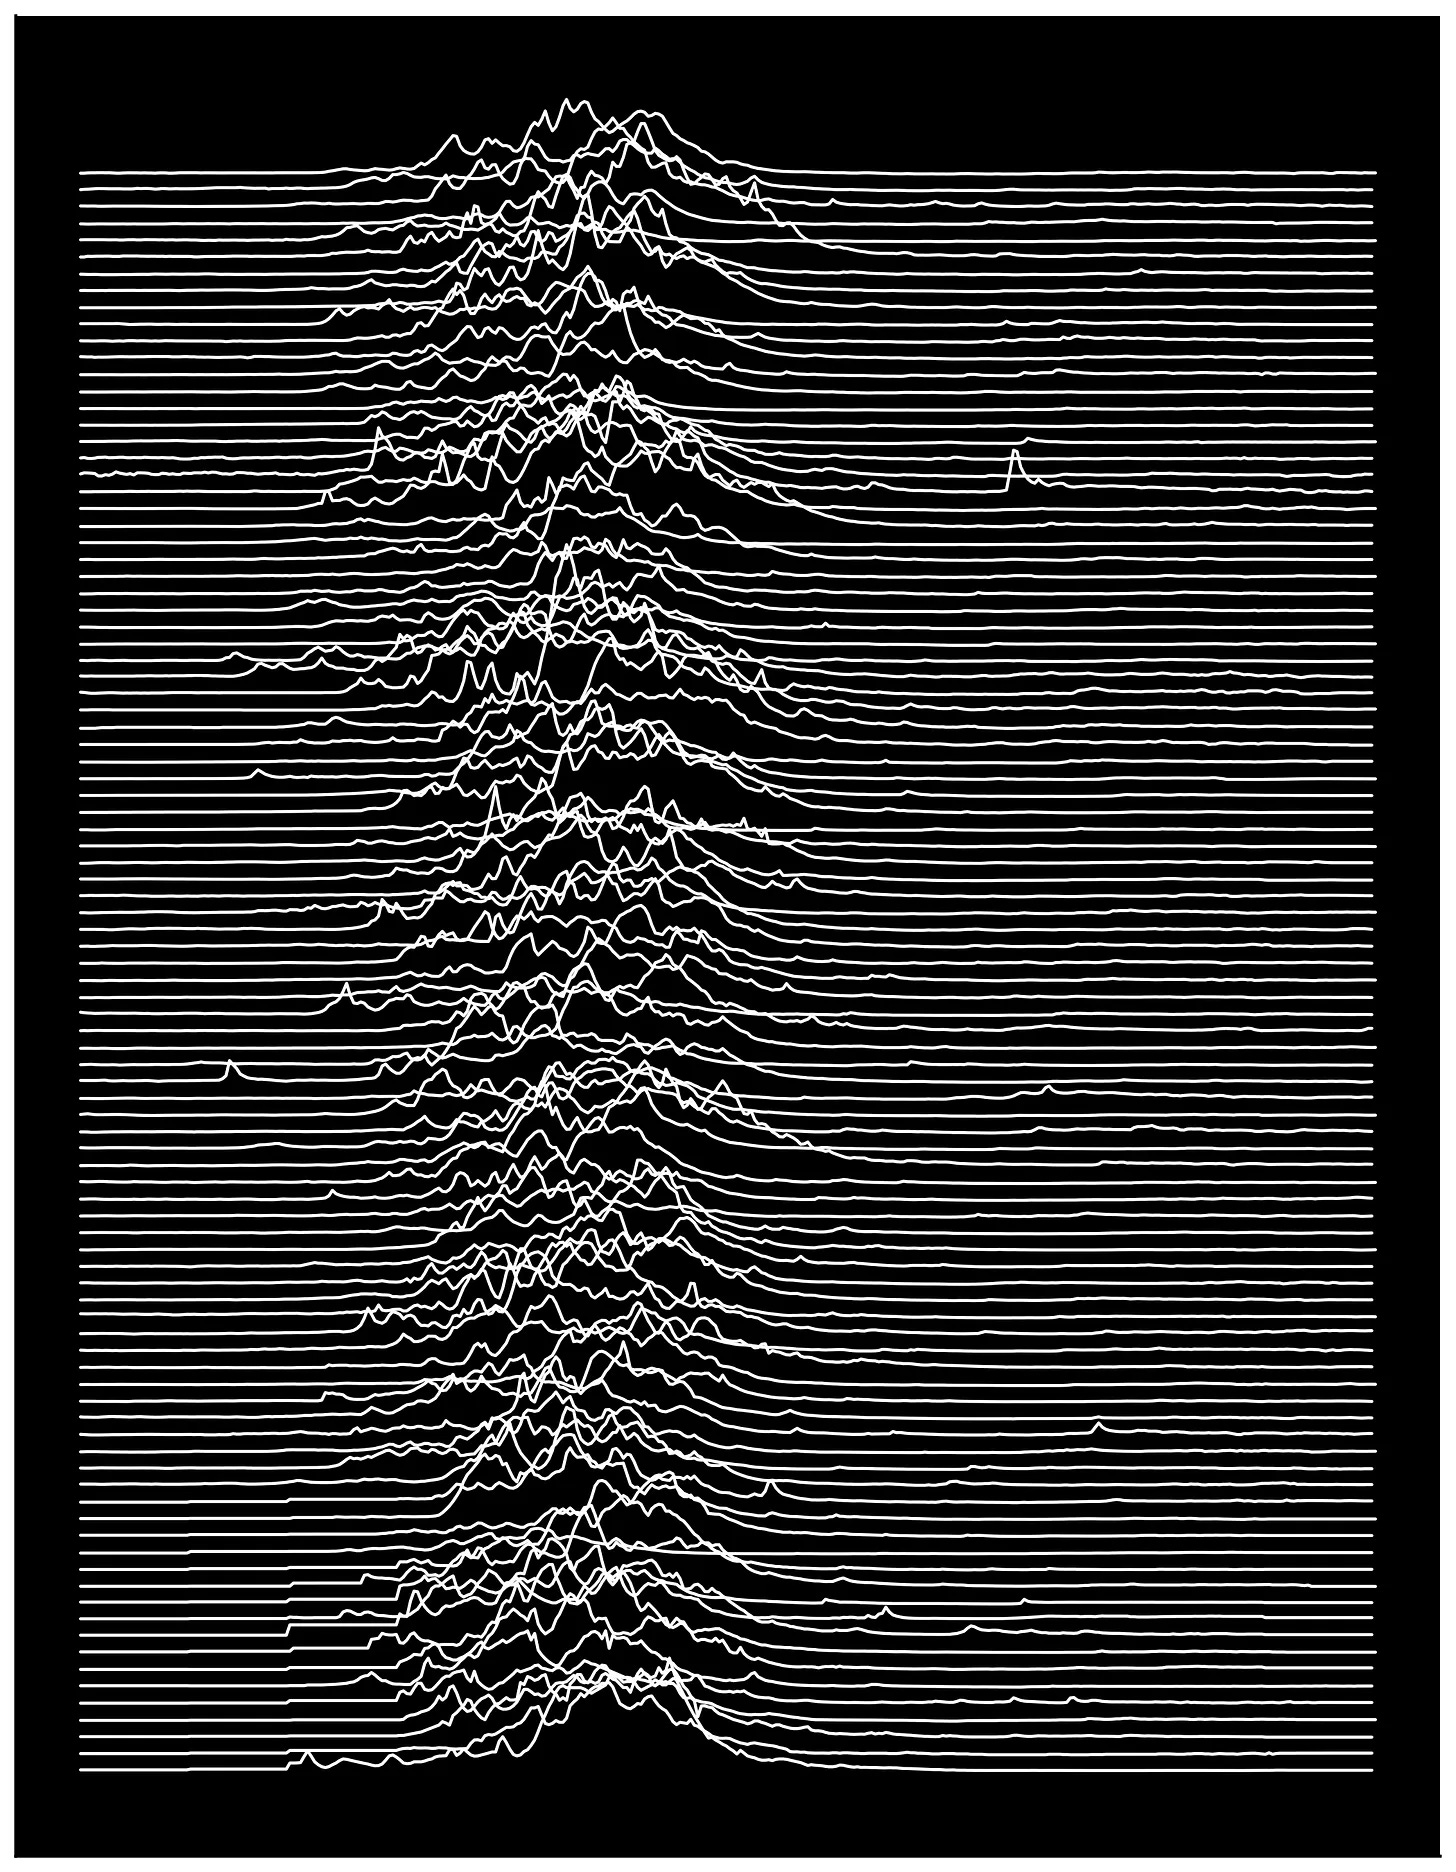
Most of this information is publicly available. What’s not is the time to read it all, connect it, and figure out what matters — or what it's like to actually do this kind of science. Below, I take you under the hood: what it means to be a modern ecologist, and how I made the ridgeline plot — for paid subscribers.
